Editor's review
This is an add in to the Visual Studio integrated development environment providing remote Linux machine debug and other capabilities.
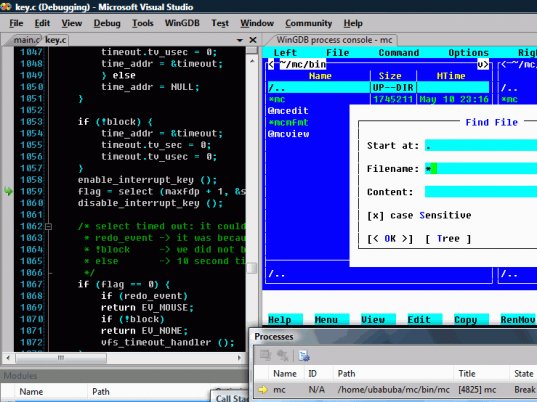
WinGDB is an extension for Visual Studio IDE. It allows debug of processes on remote machines running Linux and other Unix systems. You could debug embedded targets or local machines using native Visual Studio debugging user interface. It works through the VS debugger interface of the IDE. Remote debug is done through gdbserver and via SSH connections. The system also provides for local debug through MinGW and Cygwin modules. Embedded Linux systems and OpenOCD/JTAG based debugging also can be carried out easily. The extension commands "Attach to process”, “Launch process", "Examine core dump" allow managing the remote debug through GDB quite easily. The tool provides capabilities such as remote source code browsing in the Visual Studio editor. Source code files are brought in as needed from the remote target.
Not only you can browse and download the source code from remote station but you can actually edit the stuff. Edited source code is updated into the remote unit when editor is closed. Debug commands that are available include Run, Step over/into/out, Break All, Continue, Run to cursor, Set Next Statement etc. The feature that lets you set breakpoints while browsing remote code could save a lot of hassles for the developers of such Linux based embedded systems and can be debugged remotely. Such breakpoints can be further refined by the ability to set conditions, hit counts, temporary disabling etc. The tool creates several windows that let you get a close view of things happening, this include Auto / Locals window, Processes window, Modules window, Threads window, Memory window, Registers window, Signals window, Disassemble view etc. For keeping an eye on the I/O activity you get to look at a console window for debugged process I/O, emulating XTerm terminal.


User comments